
click to enlarge
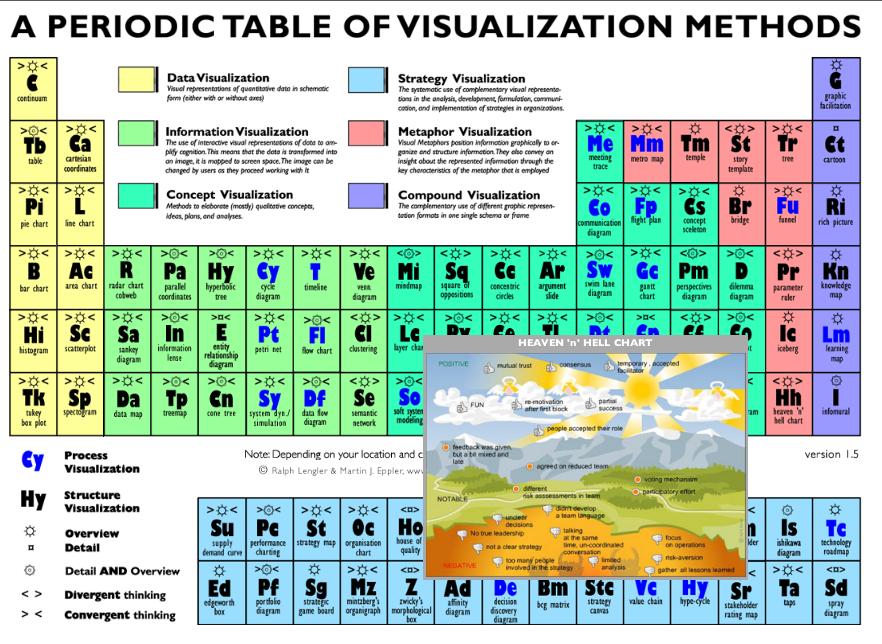
Visit the following link to access the pop-up examples for each of the Periodic Table of Visualizations‘ cells.
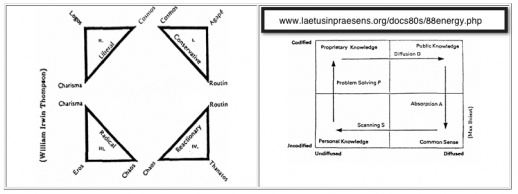
I’m fond of graphical ways of showing relationships between concepts and domains.
Here’s a few more depictions from my own archive of helpful visuals.

Scales on pseudo-symmetrical \’U\’

Arthur S. Young\’s two fundamental developmental \’turns\’
Fourfold (Anthony Judge)click to enlarge

Spiral Dynamics-AQAL Collage


Warren Matrix
